Many of you are already familiar with Application Performance Monitoring (APM) in on-premise world. Applications are written to work perfectly but there are so many variables those can alter the behavior of applications and you have to be ready to troubleshoot the unknowns. Unlike on-premise world, you may not have access (RDP) to the host server specially when you are running Azure Function Apps because the infrastructure is managed by cloud provider and it makes it harder to troubleshoot at runtime. Your goal is the identify and take proactive actions before your customers call you. To do so, we need APM tools to be integrated with our applications.
There are many industry leading tools to monitor applications at on-premise world and some of them are already available in cloud. It makes sense to adopt a tool that you are already familiar with- if it works in cloud environment. I was fortunate enough to evaluate and help in the implementation of APM tool at my work and I know what are the minimum requirements for selecting an APM tool. DynaTrace happened to be the tool that used at the enterprise but I am open to any tool that works in cloud environment. I should add disclosure here, I have no financial interest in DynaTrace and I am not here to promote any particular tool. I picked DynaTrace as the first APM tool to evaluate to see how it works in cloud. Let’s take a look what we can do monitor applications in Azure.
Learning objectives:
- Add/integrate APM with applications
- Deployment Status- what’s being monitored
- Synthetic Monitoring
- Real-User Monitoring
- Transactions and Drill into details (PurePath)
- Diagnostic Tools
Add/integrate APM with applications
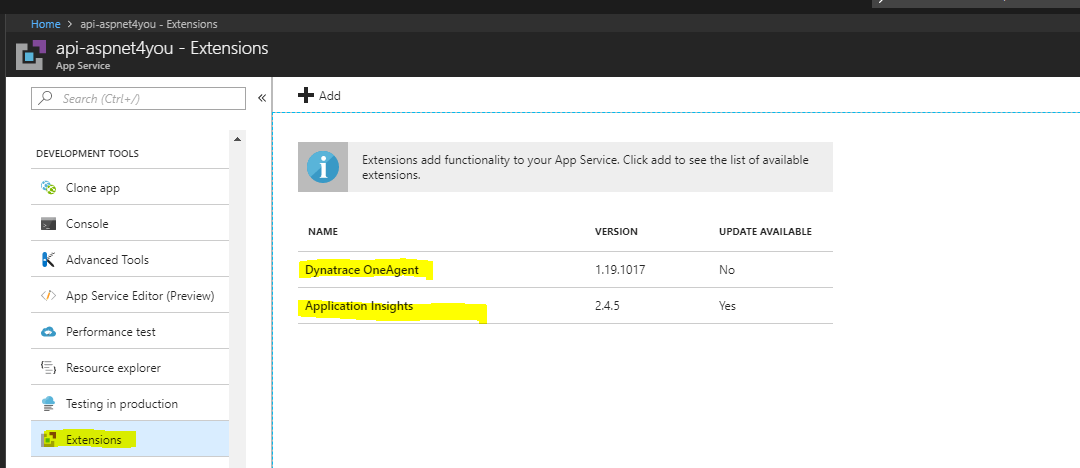
Select the resource that you want to monitor. I am showing api-aspent4you resource as an example here. We add/integrate APM via Development Tools>Extensions. You would find DynaTrace OneAgent when you click Add button and go through the wizard to complete the installation. You will need to add some settings under App Settings section of your application. Follow the instructions at “How do I monitor Microsoft Azure Web Apps?” to complete the configurations. You would need to restart the application after the configuration is completed.
If you are trying to monitor Angular applications, you would need to go for agent-less monitoring. The keyword “less” is confusing, you will need to inject javascripts in the index.html file!
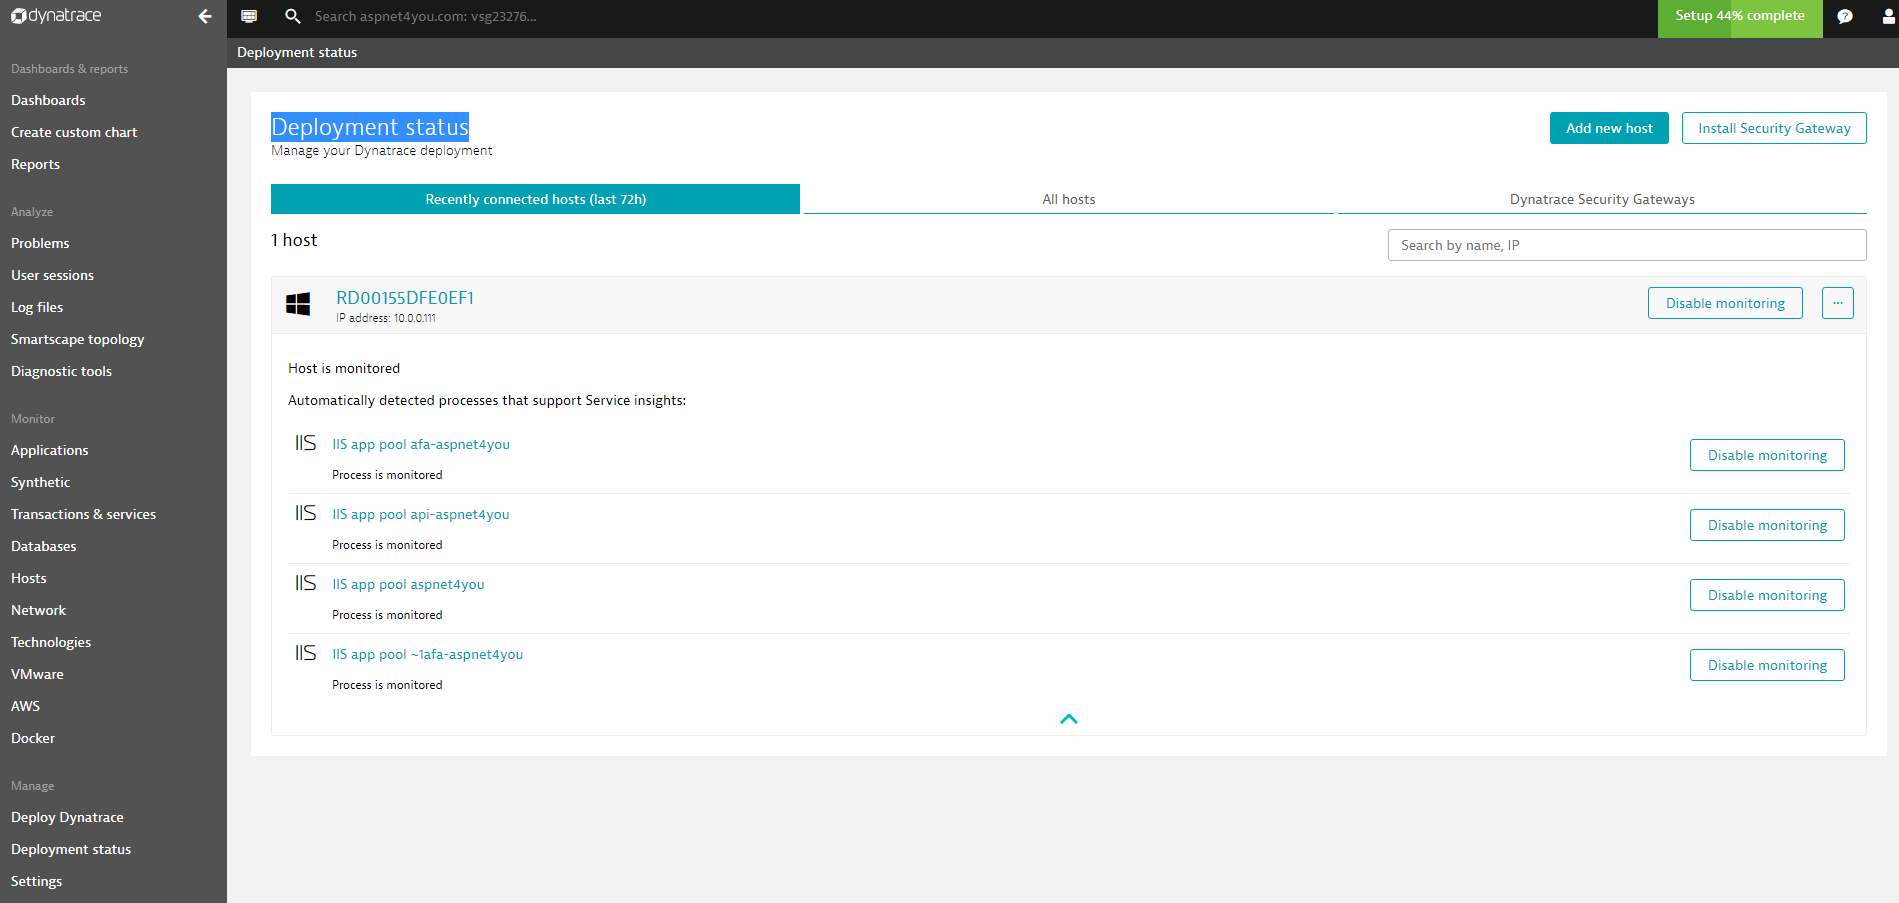
Deployment Status
You want to know what applications are being monitored. In my case, I am monitoring API, Function App and Angular (frontend) applications and they should show up in the deployment status.
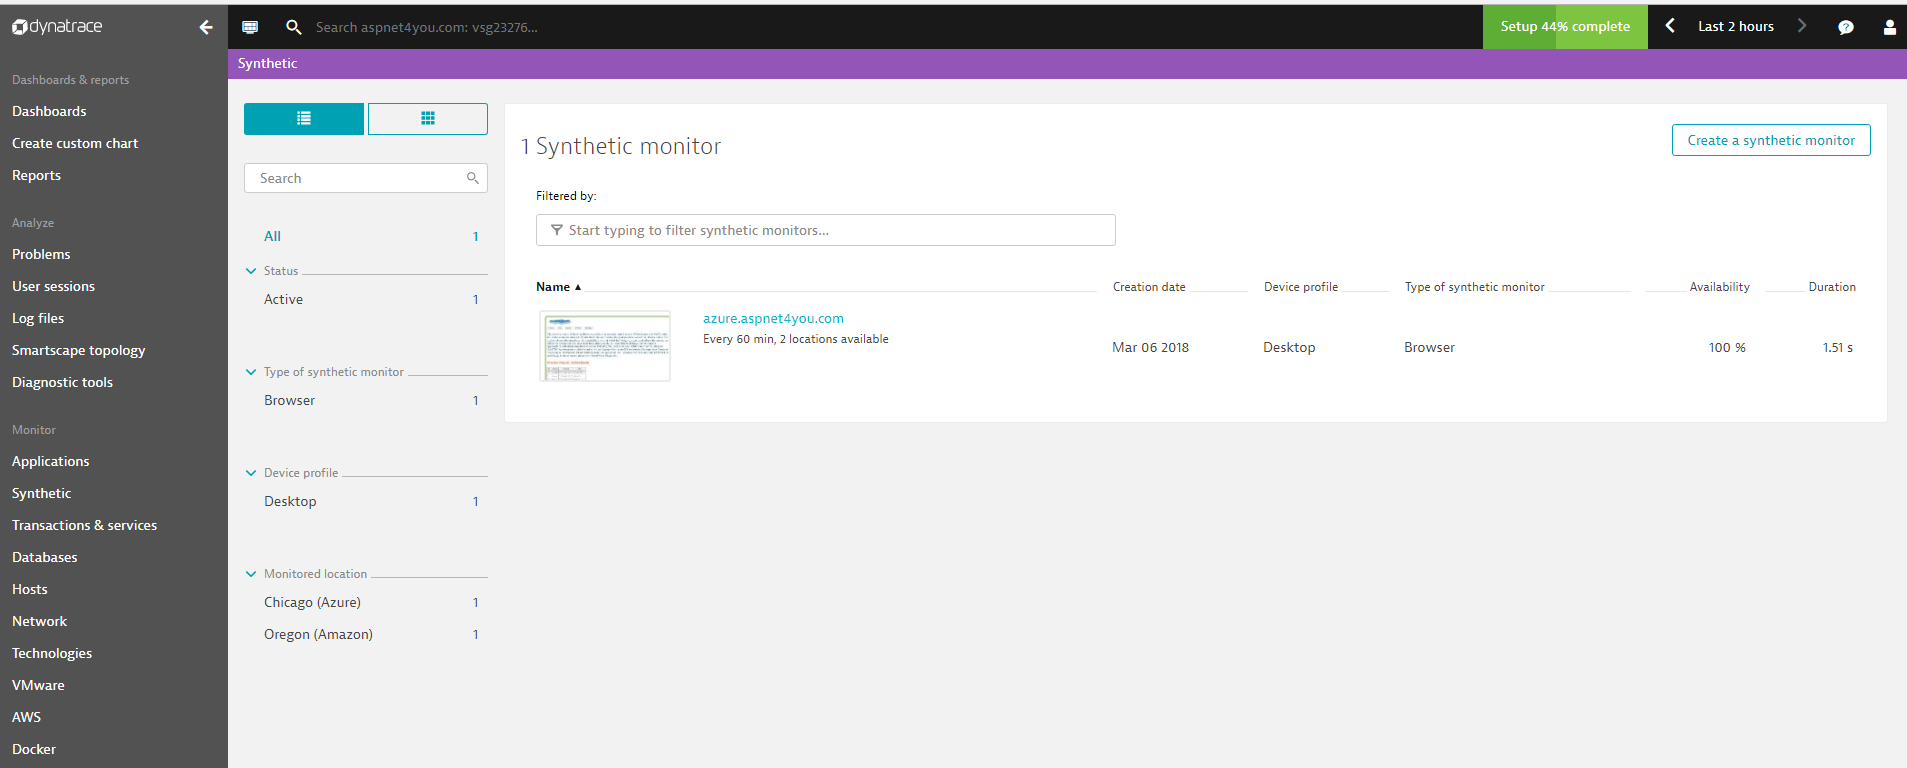
Synthetic Monitoring
Just because your web application is accessible from your office and runs great on your laptop doesn’t mean that your customers around the world are also having a great experience with your application. We would use simulated users to visit applications to ensure users are happy with their visits!
I am monitoring Angular app for Synthetic Monitoring but you can configure any app. To keep it simple, we configured to monitor from Chicago and Oregon geographic regions.
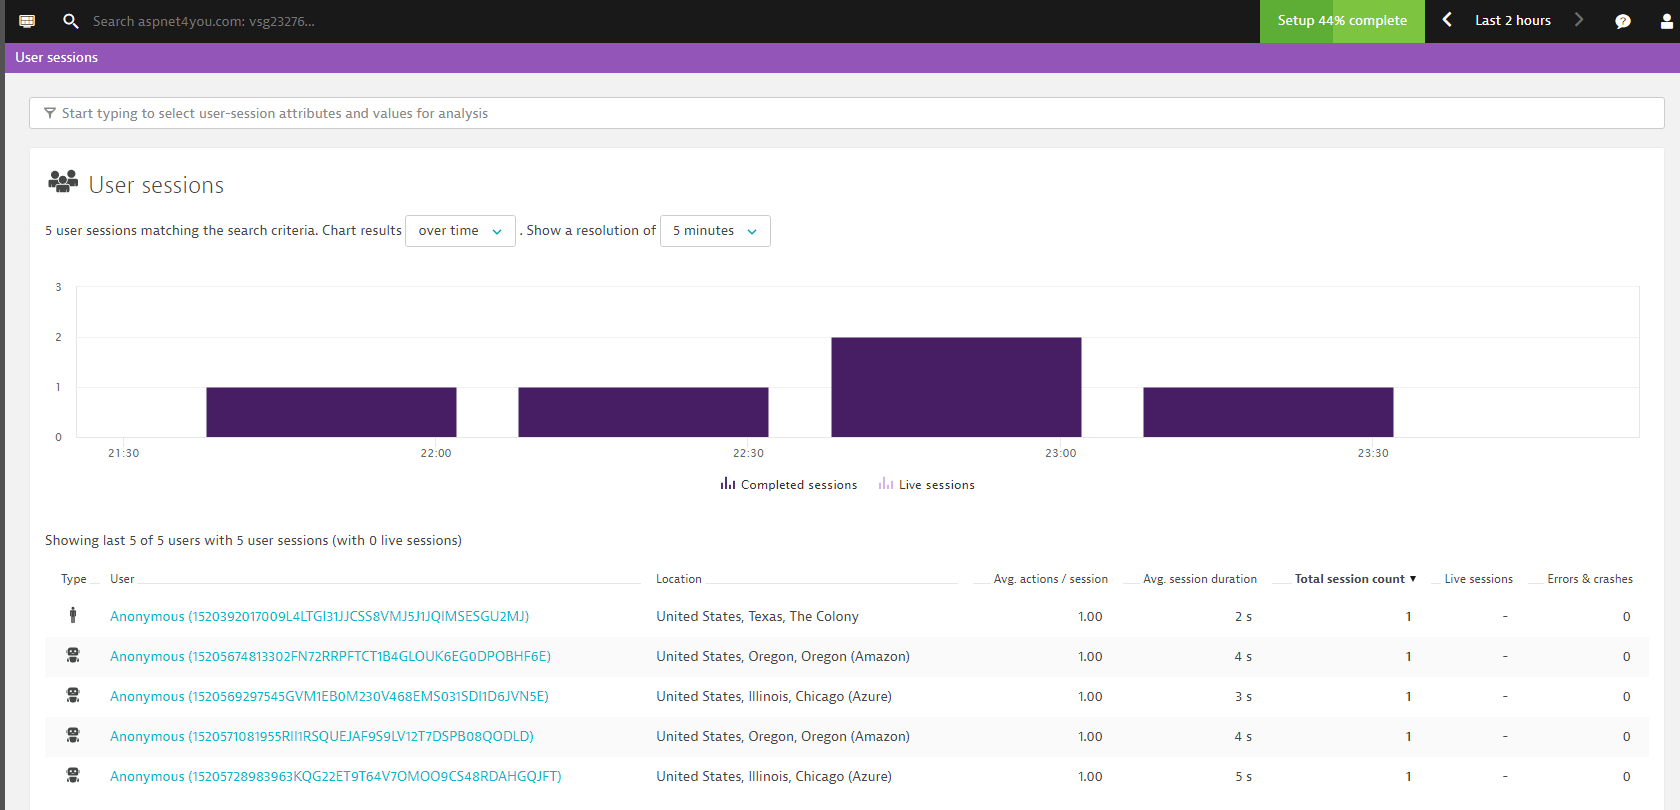
Let’s see the user sessions. You can see Chicago, Oregon and The Colony. The Colony is showing my own browser session and it is considered real-user session!
Real-User Monitoring
Real user monitoring provides the insights you need to deliver an exceptional customer experience, letting you follow the experience of each user as he/she interacts with your website and applications. This is accomplished by injecting JavaScripts into browser. User’s activities (i.e. click events) then sent to the backend server with necessary correlation and we can use the data to do intelligent reporting and/or build alerts.
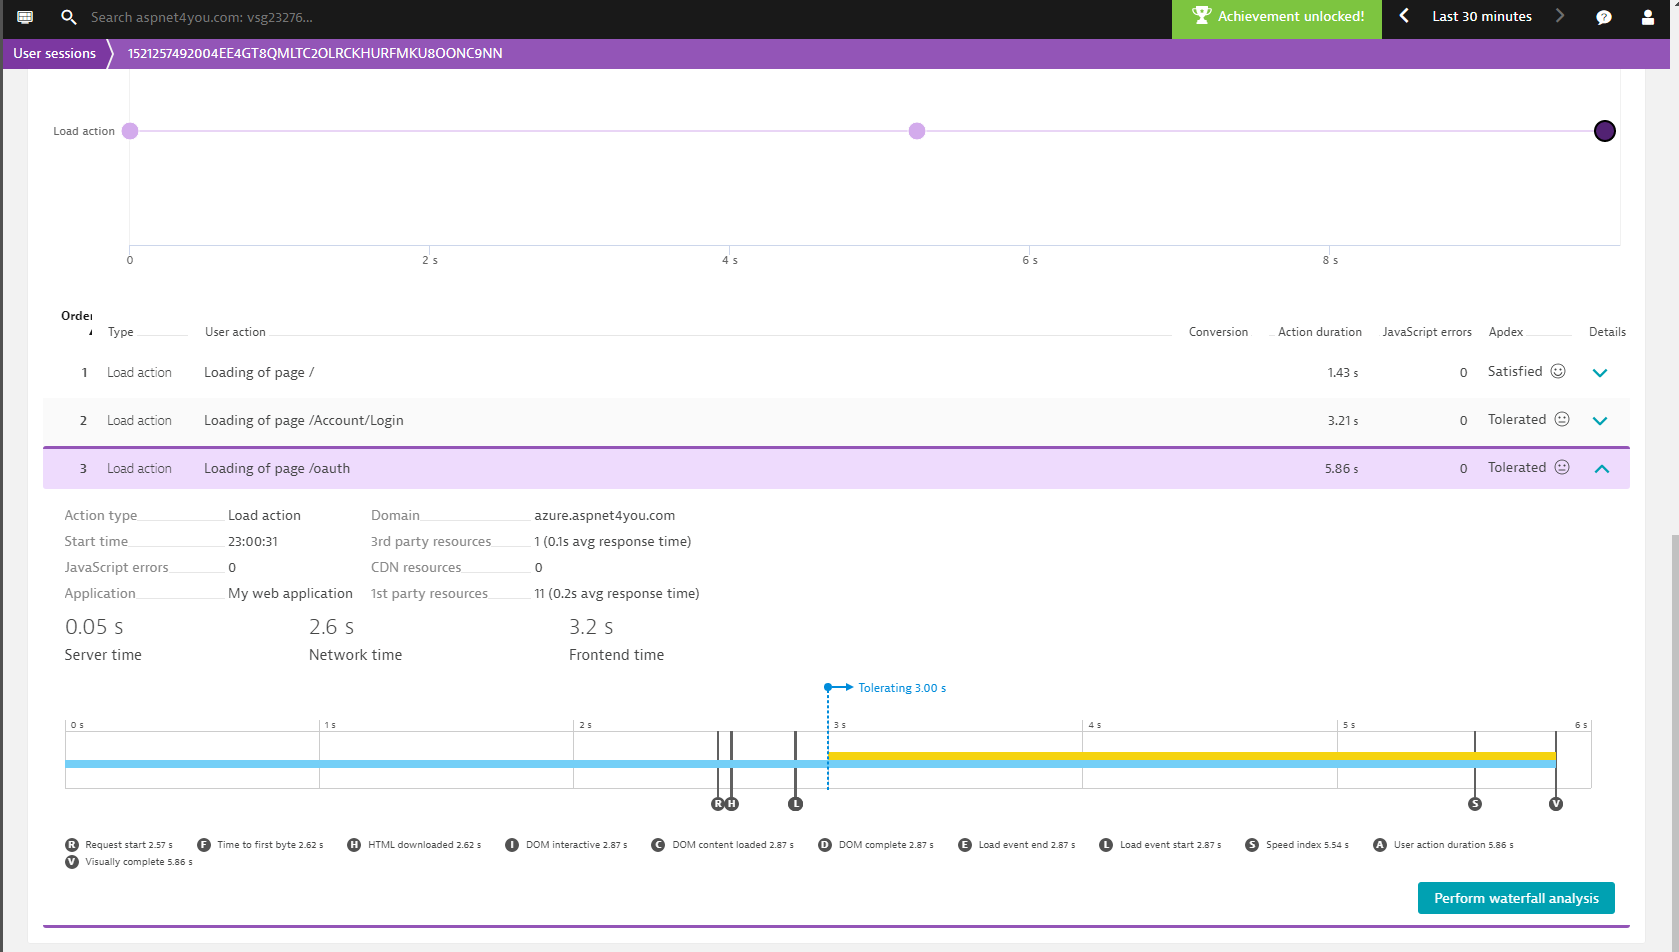
Let’s look at the user’s session from The Colony, TX.
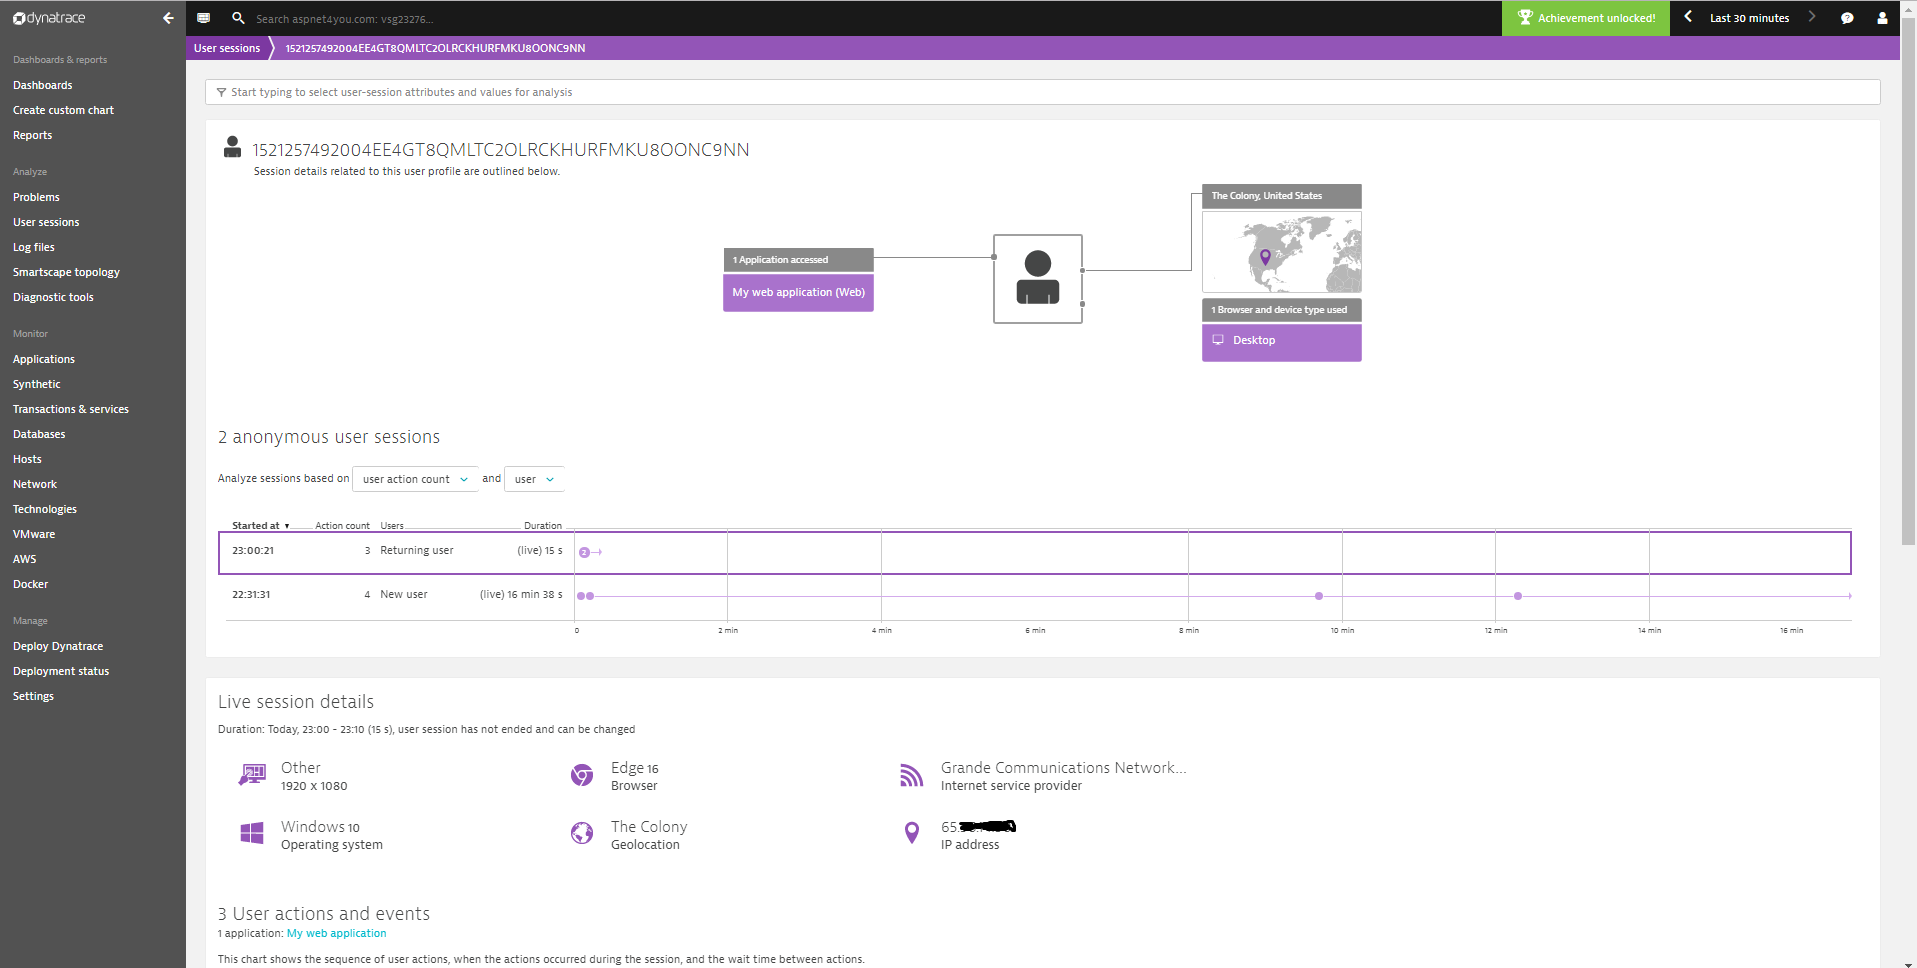
We can see user’s actions, response time, etc. in the detail view-
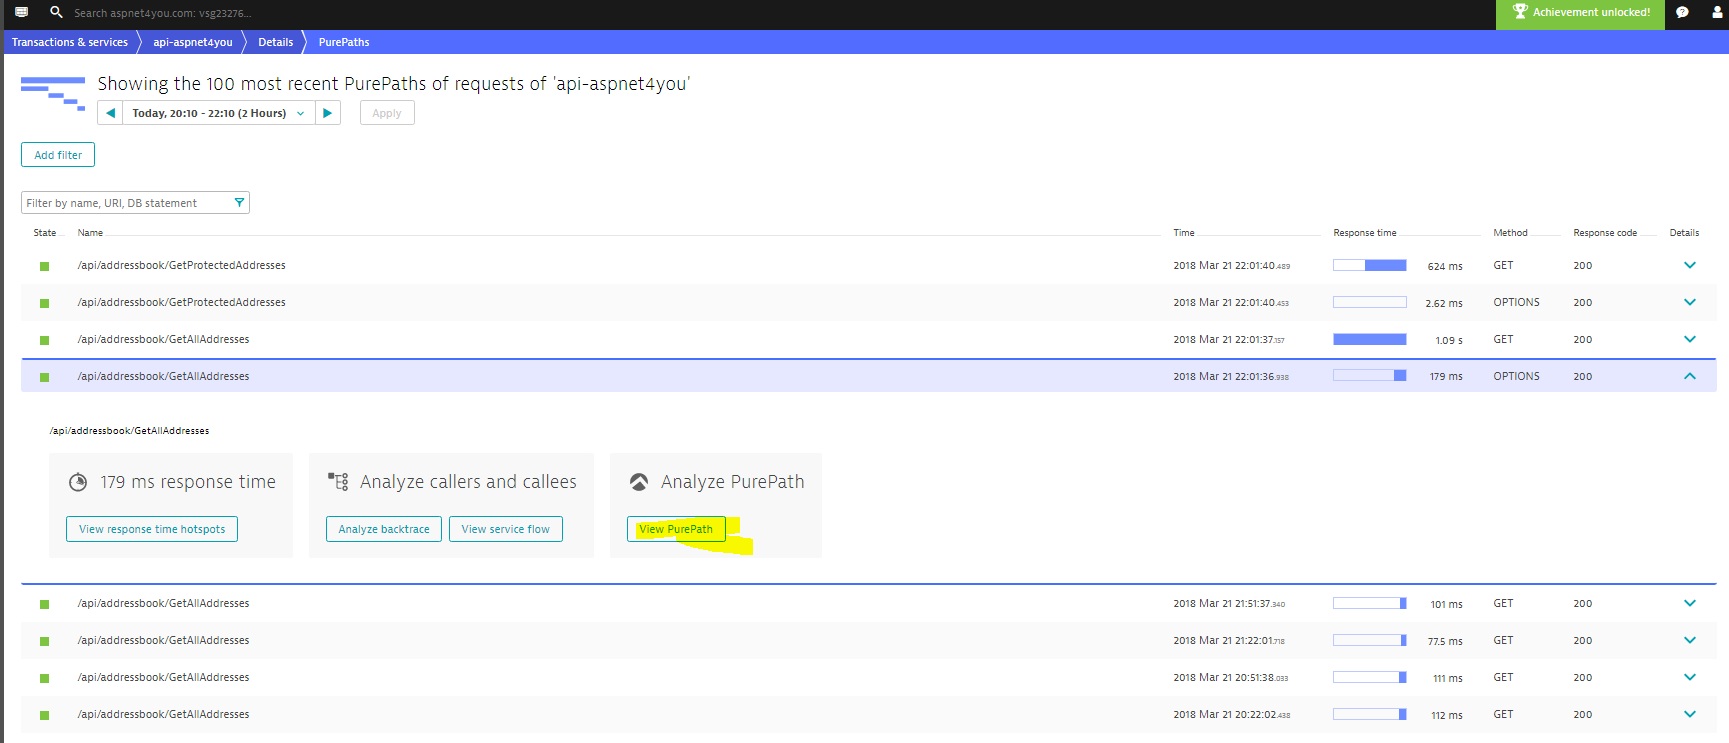
Transactions and Drill into details (PurePath)
We wanted to look at the transactions but we don’t know where to start! We need to start at the application/process (app pool in my case) and drilldown to transactions of interest.
Processes (Transactions and Services)-
![]()
PurePaths from api-aspnet4you application-
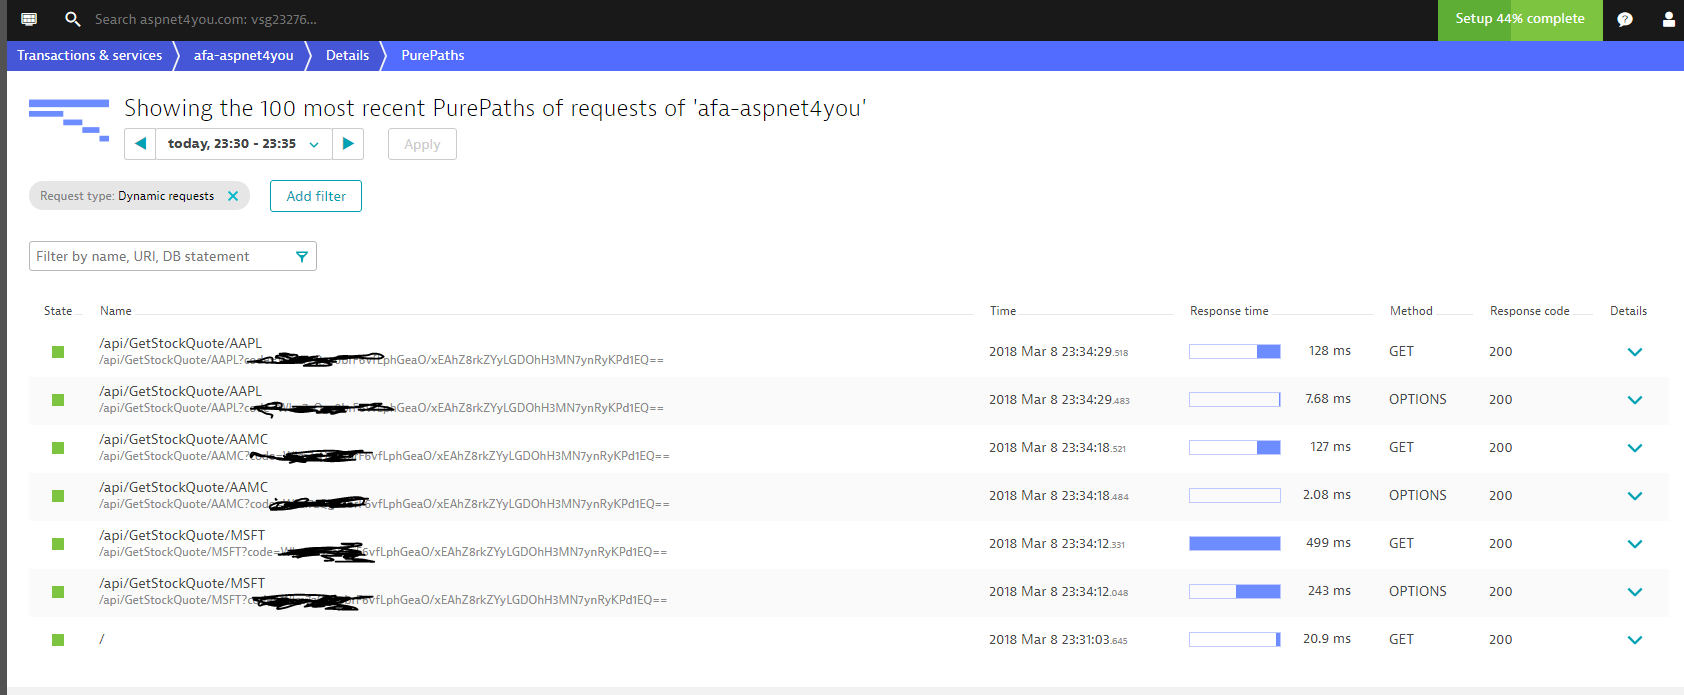
PurePaths from function app (afa-aspnet4you). It’s important to note that APM tool would capture url with querystring and it’s not good idea to pass security token as part of the url. I was using the code as query string but I switched to jwt token which is passed in the authorization header of http/s request.
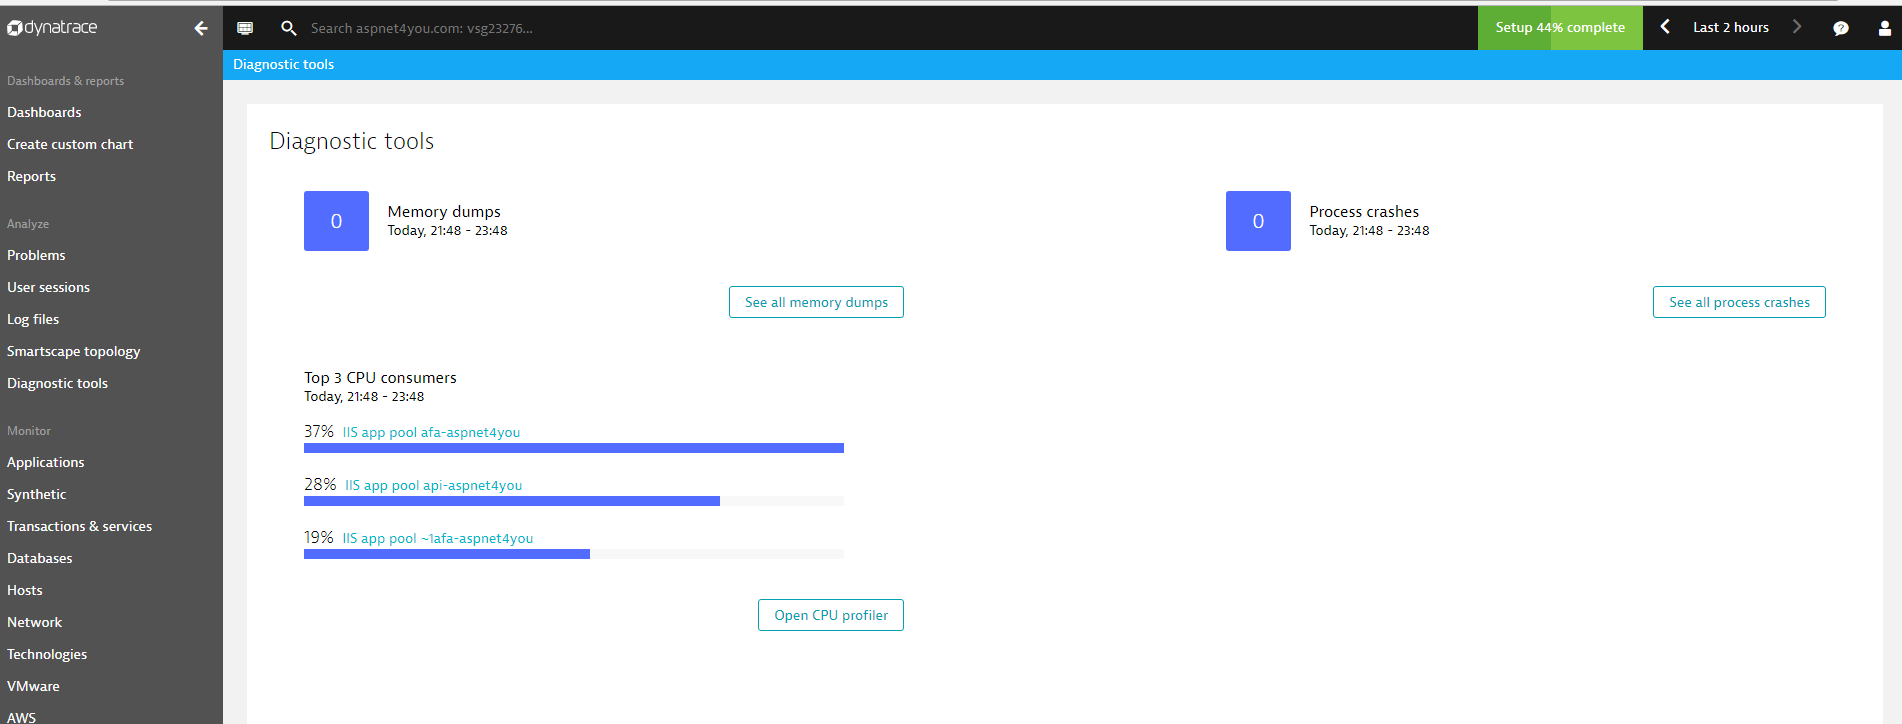
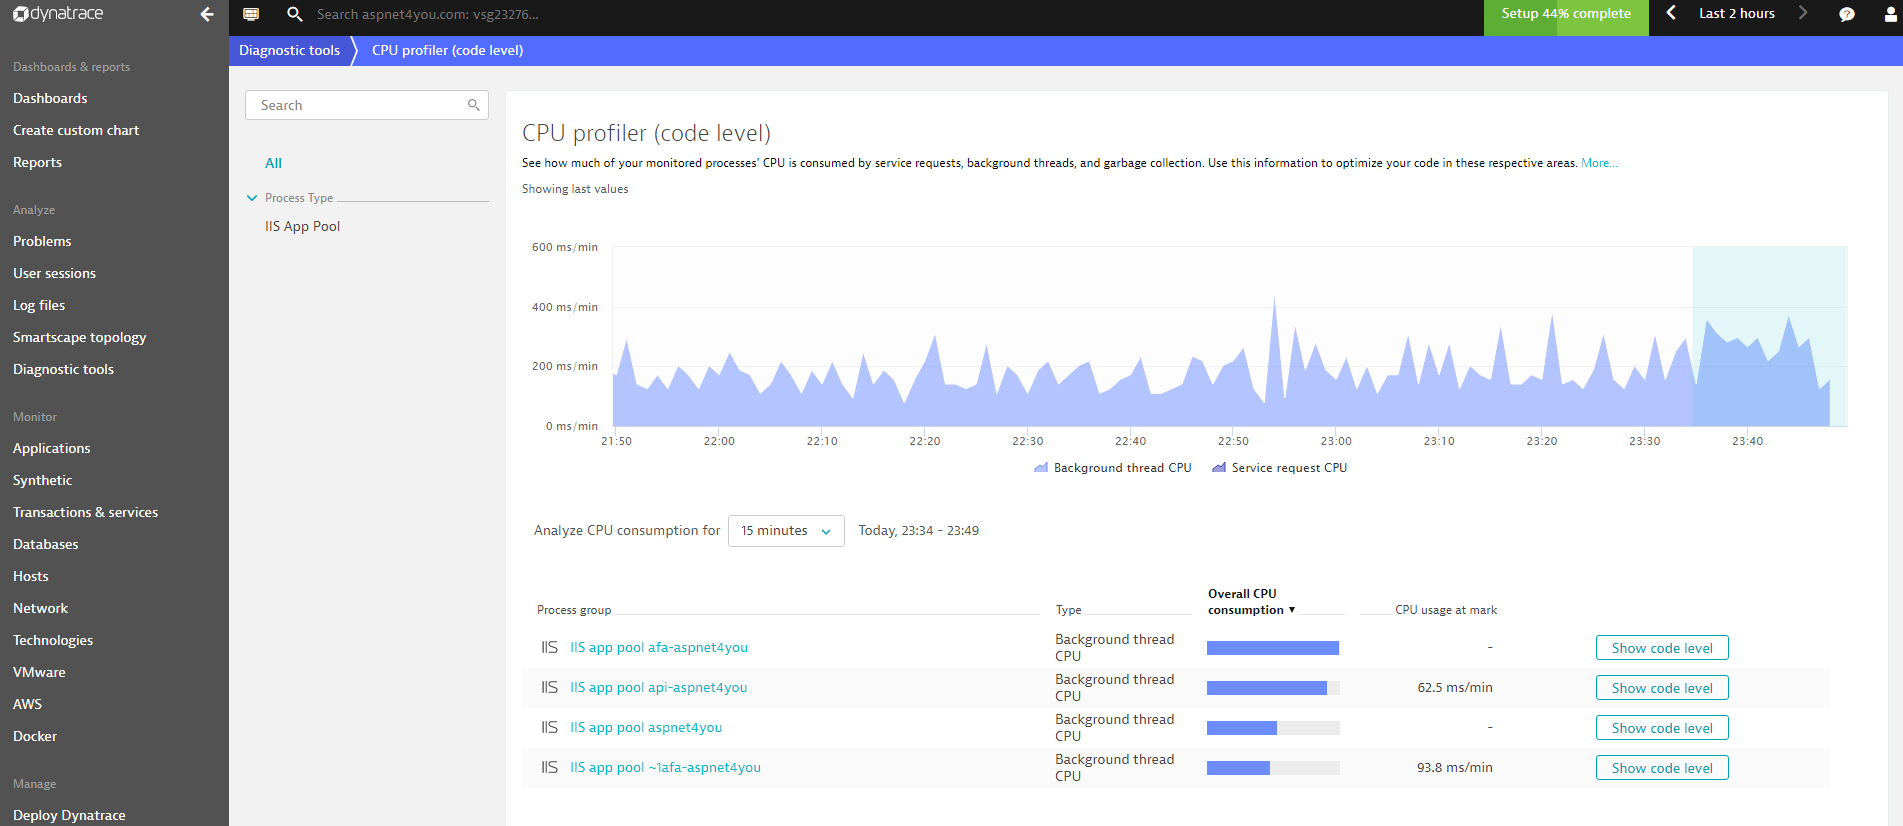
Diagnostic Tools
There are times your application may crash for excessive memory or CPU usages. We have to know the root cause of the problem. We can debug (remote debug) the problem but there are times when you have no choice but to analyze memory dump to know the root cause! It’s rare but we have to be ready for all eventuality. We can use DynaTrace diagnostic tool to analyze CPU and memory.
Summary
We can use Application Insights extension provided by Microsoft for free to monitor applications and we are already using Application Insights. However, other 3rd party tools/extensions provide additional capabilities- PurePaths to drill into the dependency details, setup alerts, thresholds, synthetic and real-user monitoring. The extra capabilities come with extra cost but it’s worthy for better user experience.