Azure Log Analytics is very powerful whether you are investigating security incidents or you are trying to track a business transaction end-to-end. If you have not setup Log Analytics in your Azure subscription, you may read my previous post, Azure Network Watcher for Monitoring, to get up to speed. Today, we are going to focus on how to track business transaction end-to-end and share some common no-sql queries to pull data from Diagnostics, ContainerLogs and AzureNetworkAnalytics.
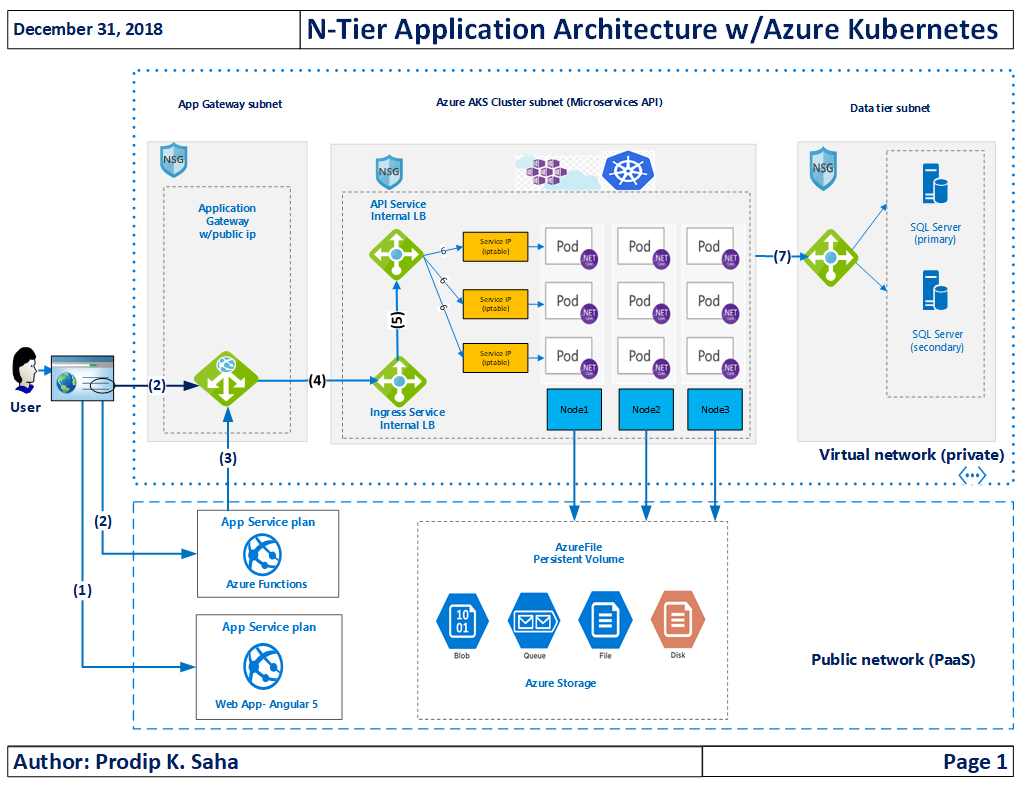
It’s important that we know the application architecture and most importantly data flow of the application. Here is the simple data flow w/o having to draw a picture! UI (Angular 5) –> Azure Functions (HTTPS Proxy) –> Azure Application Gateway (vNET joined proxy to Kubernetes cluster) –> API Microservices Application in Kubernetes PODS/Containers. For security reason, we don’t expose Kubernetes POD to internet and we need an intelligent proxy like Application Gateway to route the traffic to vNET (Virtual Private Network). Application Gateway is connected to a subnet of vNET and NSG is used to control in/outbound traffic. App Gateway does not accept any connection from internet but it does accept connections from Azure Functions (outgoing IPs attached to the resource). We want to secure our application and, at the same time, we want to track activities in each endpoints. Enough of lecture on security and architecture, let me share a diagram as it worth 1000 times of words!
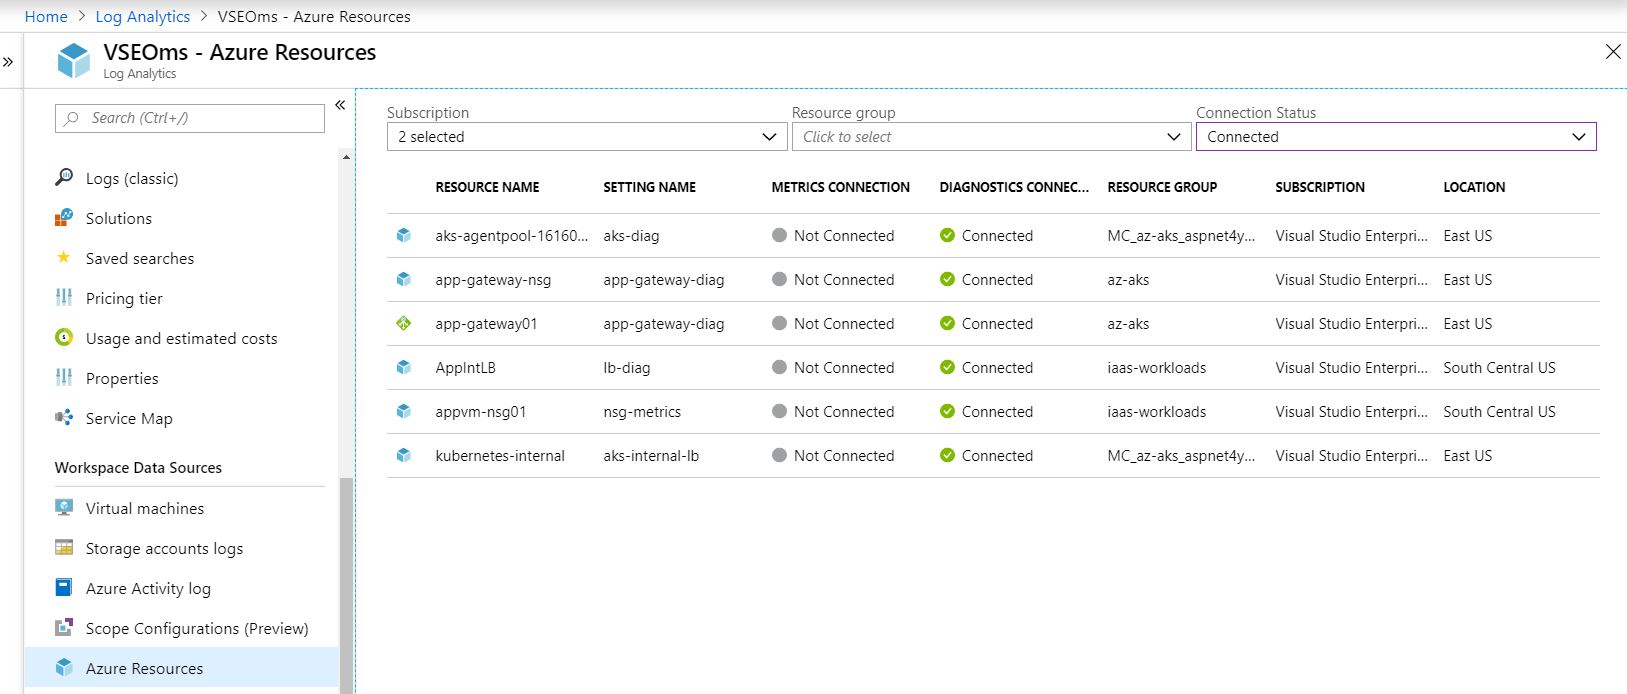
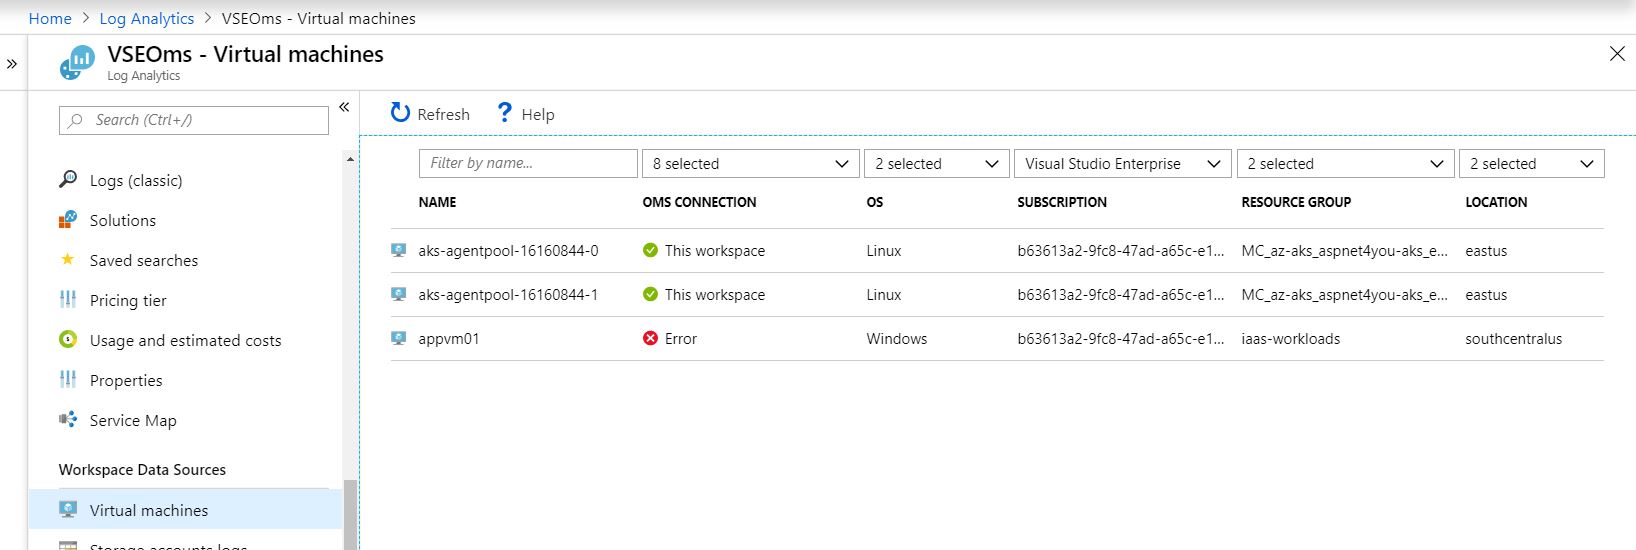
We have to turn on Diagnostics, NSG Flow and configure Workspace Data Sources to collect data. You can follow documentation, Create a Log Analytics workspace in the Azure portal, at Microsoft portal if you have not done so already. Data collection is important first step and we would like to configure the resources important for end-to-end tracking. Azure collects and records lot of data fields but it may not provide sufficient correlation. You must collaborate with AppDev team and update the application code to capture/log few http/s request headers in order to achieve successful end-to-end correlation.
As part of data collection, let’s open our Angular UI application, https://azure.aspnet4you.com, and play with Adventure Works 2017 Demo! This should trigger the data flow and in few minutes we would be able to track the transaction. Let’s go to Azure Monitor in Azure Portal and click Logs to bring up the query interface. To save time, we are going to use a query saved earlier and we will just run it!
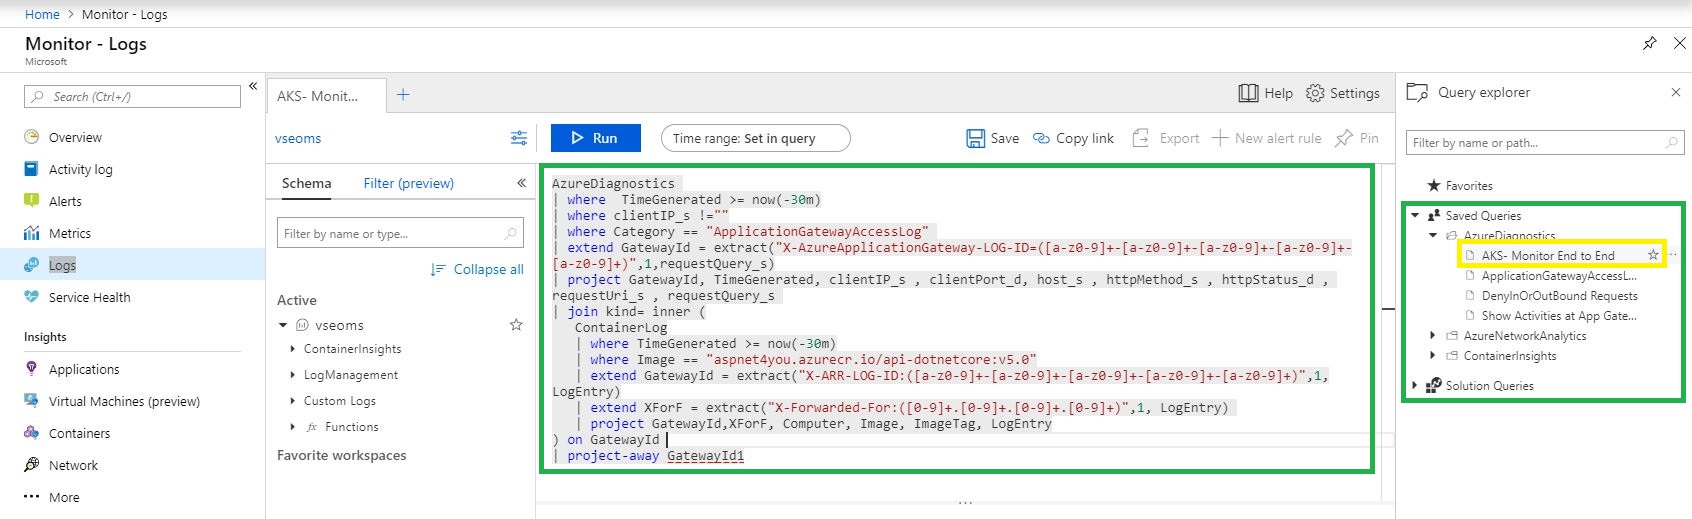
Let’s see the query-
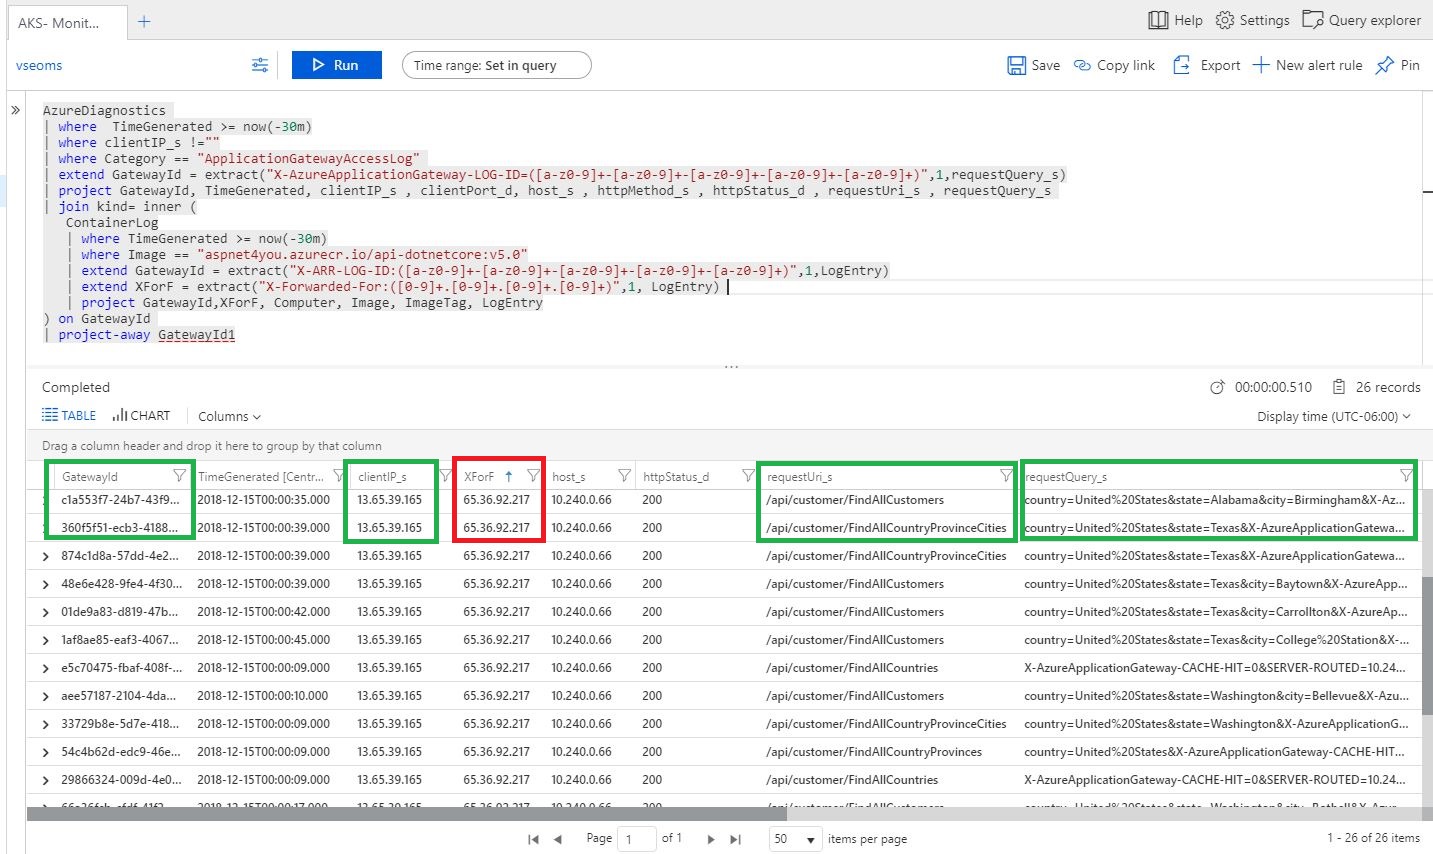
AzureDiagnostics | WHERE TimeGenerated >= now(-30m) | WHERE clientIP_s !="" | WHERE Category == "ApplicationGatewayAccessLog" | extend GatewayId = EXTRACT("X-AzureApplicationGateway-LOG-ID=([a-z0-9]+-[a-z0-9]+-[a-z0-9]+-[a-z0-9]+-[a-z0-9]+)",1,requestQuery_s) | project GatewayId, TimeGenerated, clientIP_s , clientPort_d, host_s , httpMethod_s , httpStatus_d , requestUri_s , requestQuery_s | JOIN kind= INNER ( ContainerLog | WHERE TimeGenerated >= now(-30m) | WHERE Image == "aspnet4you.azurecr.io/api-dotnetcore:v5.0" | extend GatewayId = EXTRACT("X-ARR-LOG-ID:([a-z0-9]+-[a-z0-9]+-[a-z0-9]+-[a-z0-9]+-[a-z0-9]+)",1,LogEntry) | extend XForF = EXTRACT("X-Forwarded-For:([0-9]+.[0-9]+.[0-9]+.[0-9]+)",1, LogEntry) | project GatewayId,XForF, Computer, Image, ImageTag, LogEntry ) ON GatewayId | project-away GatewayId1 |
Let me explain how we captured data at different points:
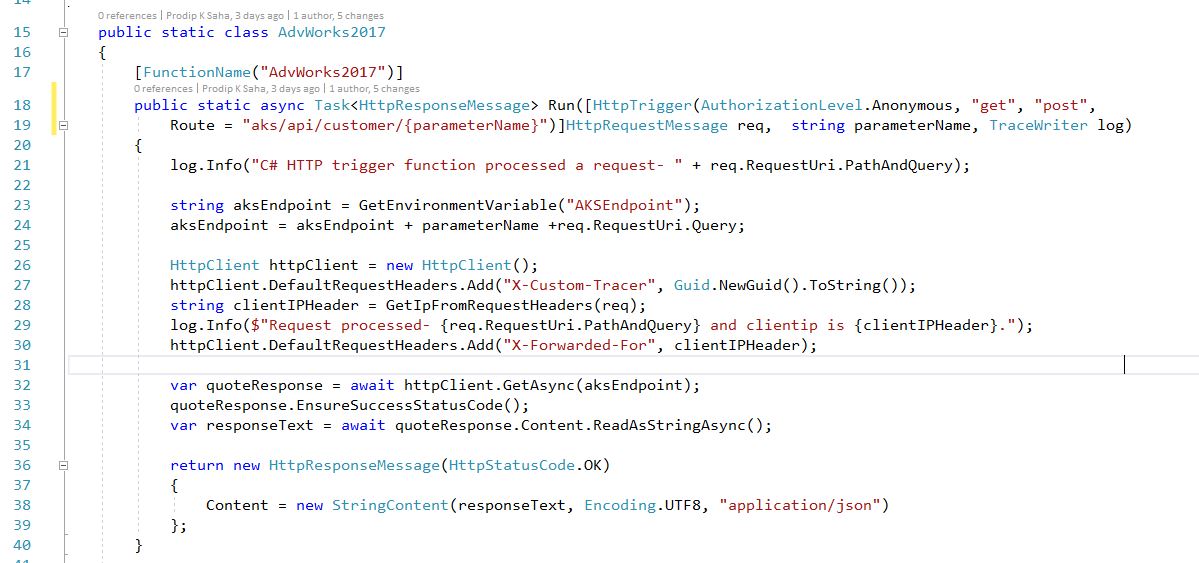
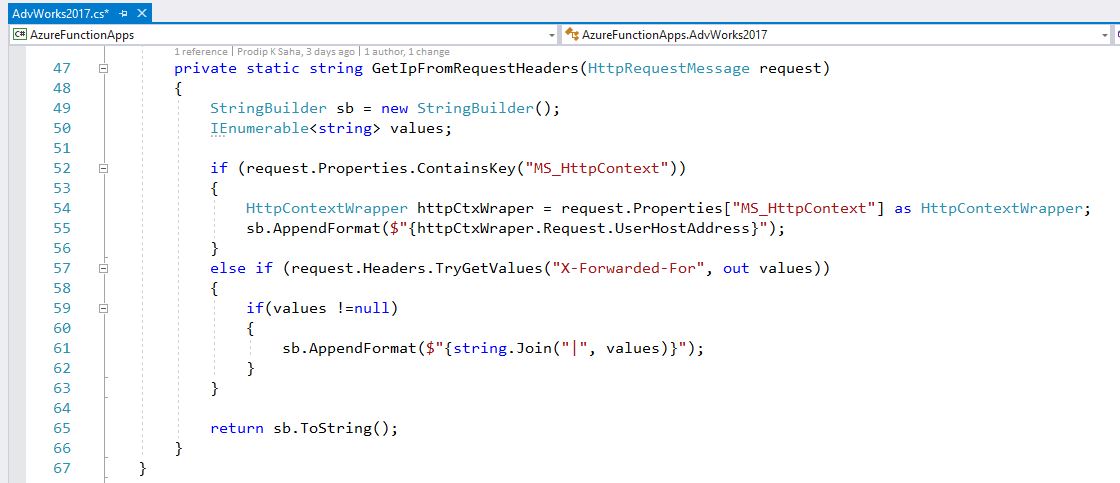
- Angular UI called Azure Function and we got to know caller’s IP address. Unfortunately, Azure strips the origin IP and passes it’s own outbound IP to App Gateway. To mitigate this problem, we changed the Azure Function to pass origin ip in the X-Forwared-For header to App Gateway. In addition, we added another custom header called X-Custom-Tracer to tag the request to connect the dots among each tier of the application. If you are using product like Incapsula or Web App Firewall (WAF), you can just configure the headers. Snippets from Azure Function (poor man’s solution!) to show how custom headers are passed on to next hop-
- If we just look at the AzureDiagnostics logs with category == ApplicationGatewayAccessLog, it does not provide enough details to make the connection. App Gateway, however, provides X-AzureApplicationGateway-LOG-ID in requestQuery_s and it passes this AzureApplicationGateway-LOG-ID to next layer (aks). It’s good but not good enough! We can use X-Custom-Tracer field to make one-one correlation. Good news is- App Gateway indeed passes the origin ip in X-Forwarded-For field and it also passes the X-Custom-Tracer to next hop. How do we know it? They were available in HttpContext inside the Container and we captured them in ContainerLog. I wish Azure makes them available in the Diagnostics log but it does not at the time of this post.
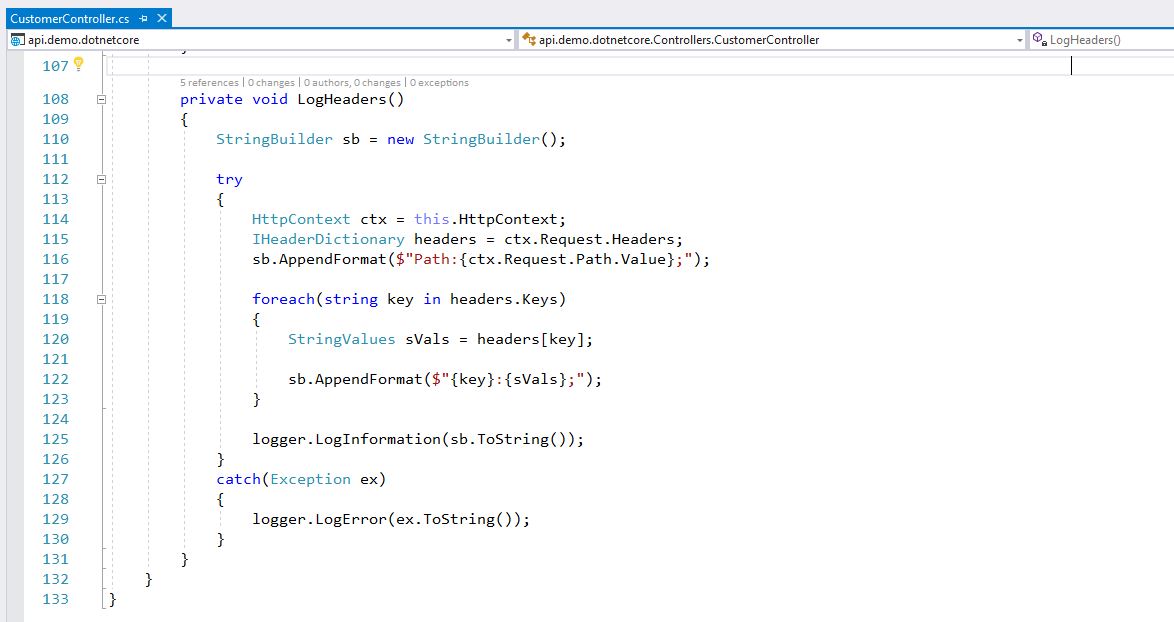
- Next, we look at the ContainerLog but we can’t make the meaningful correlation unless app running inside the container log those custom headers passed by App Gateway. I am sure there are other ways/tools to collect data from http/s header and log them. This is where we need the collaboration with Developers and it’s easy for .Net or Java code to log the headers and persist somewhere. Azure Container monitor will capture those logs and we don’t have to query external sources (i.e. log files, AzureFile). I updated my Asp.Net Core application to capture the headers and write to AzureFile persistent volume.
Let’s see the results. You can clearly see my ip (in XForF), GatewayId (added by App Gateway), request path and query. We can extract X-Custom-Tracer from LogEntry field of Containerlog to see one-one correlation. Bingo!
Let me share few other queries that I saved during the investigation-
Show Activities at App Gateway in last 30 minutes:
AzureDiagnostics | WHERE TimeGenerated >= now(-1h) | WHERE Category == "ApplicationGatewayAccessLog" | project TimeGenerated, clientIP_s , clientPort_d, host_s , httpMethod_s , httpStatus_d , requestUri_s , requestQuery_s |
DenyInOrOutBound Requests:
AzureDiagnostics | WHERE TimeGenerated >= now(-1h) | WHERE ruleName_s IN ("DefaultRule_DenyAllOutBound","DefaultRule_DenyAllInBound", "DefaultInboundDenyAll") | project ruleName_s, direction_s, type_s, Resource, TimeGenerated, conditions_sourceIP_s, subnetPrefix_s, primaryIPv4Address_s |
Denyinbound requests:
AzureNetworkAnalytics_CL | WHERE TimeGenerated >= now(-6h) | WHERE FlowStatus_s == "D" | WHERE PublicIPs_s != "" | project TimeGenerated,PublicIPs_s, FlowStatus_s,NSGRules_s, Country_s, VMIP_s, DestPort_d, L7Protocol_s, AllowedInFlows_d, DeniedInFlows_d, AllowedOutFlows_d, DeniedOutFlows_d |
Denyinbound requests- more than one ip:
AzureNetworkAnalytics_CL | WHERE TimeGenerated >= now(-24h) | WHERE FlowStatus_s == "D" | WHERE PublicIPs_s != "" | WHERE strlen(PublicIPs_s) >= 28 | project TimeGenerated,PublicIPs_s, FlowStatus_s,NSGRules_s, Country_s, VMIP_s, DestPort_d, L7Protocol_s, AllowedInFlows_d, DeniedInFlows_d, AllowedOutFlows_d, DeniedOutFlows_d |
Allowinternetoutbound requests:
AzureNetworkAnalytics_CL | WHERE TimeGenerated >= now(-6h) | WHERE (NSGRules_s contains "allowinternetoutbound") | WHERE PublicIPs_s !startswith "10." | project TimeGenerated, FlowStatus_s,NSGRules_s, PublicIPs_s, Country_s, VMIP_s, DestPort_d, L7Protocol_s, AllowedInFlows_d, DeniedInFlows_d, AllowedOutFlows_d, DeniedOutFlows_d |
Your design and use case may be different but this post should provide you with ideas how to insert customer headers when cloud provider can’t solve the puzzle! It’s important to note that some of the data fields captured in the Log Analytics fall under PII/GDPR. Those are required to run the business and for troubleshooting problems. However, you must take adequate measures to safeguard the data at rest (encryption, randomization, pseudonymization, etc.), take additional controls to prevent unauthorized access and monitor activities to comply with PII/GDPR.