Network Security Group (NSG) flow logs provide information that can be used to understand ingress and egress IP traffic on network interfaces. These flow logs show outbound and inbound flows on a per NSG rule basis, the NIC the flow applies to, 5-tuple information about the flow (Source/Destination IP, Source/Destination Port, Protocol), and if the traffic was allowed or denied.
NSG logs are important specially when you want to know how far an attacker may have penetrated into your systems. You start from entry point and connect the dots to figure what systems may have been impacted from an intrusion. When you have multiple accounts or subscriptions in cloud, it’s not easy job to take top down view of the universe unless you can centralize the logs.
This post demonstrates how to centrally manage NSG flow logs using Grafana, an open source graphing tool, ElasticSearch, a distributed search and analytics engine, and Logstash, which is an open source server-side data processing pipeline. While Grafana has option to use SaaS service where you can plug-and-play Azure Monitor with few clicks. SaaS option is good for POC but flow logs can be massive and you have to think of egress cost. It may be better for you to host the monitoring infrastructure in your cloud account/subscription. Another important architectural decision to highlight here is, we are reading the flow logs directly from Azure Storage account in near real-time. Azure Log Analytics collect data at hourly interval and you have to wait for an hour before you can see network flow logs in Azure Log Analytics! For the purpose of the demo, I am using the all-in-one machine (Ubuntu VM) to host logstash, elasticsearch and grafana services but you should distribute the workloads in production environment.
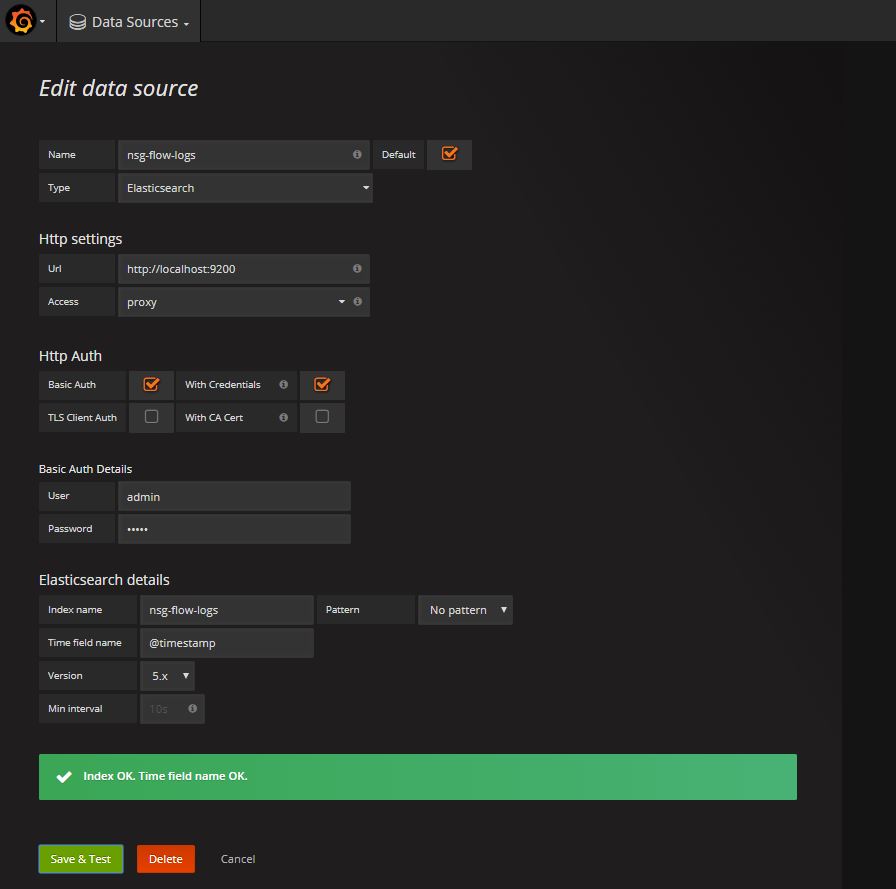
Let’s see what it takes to get Grafana running! You will need a VM and it’s easy to create one in Azure. We will follow Microsoft documentation which is good enough except few hiccups you may encounter. I had to install JAVA but it was not in the instruction. Also, logstash, elasticsearch and grafana services were not enabled by default. I had to run systemctl enable [name of the service]. It was the root cause why I was getting no index error when configuring Data Source!
Once installation is done, you can can access Grafana using Azure public ip with port 3000. Create a new data source and start a new dashboard with few panels. That’s about it, Grafana rocks!
Create and configure a new dashboard along with filters using the data source you have configured. We are going to add a table panel and edit the details- general, metrics, options, column headers, etc. Change the data source at the metrics tab and click Metric to set it to RawDocument. Don’t forget to configure NSG resources and trigger some network activities!
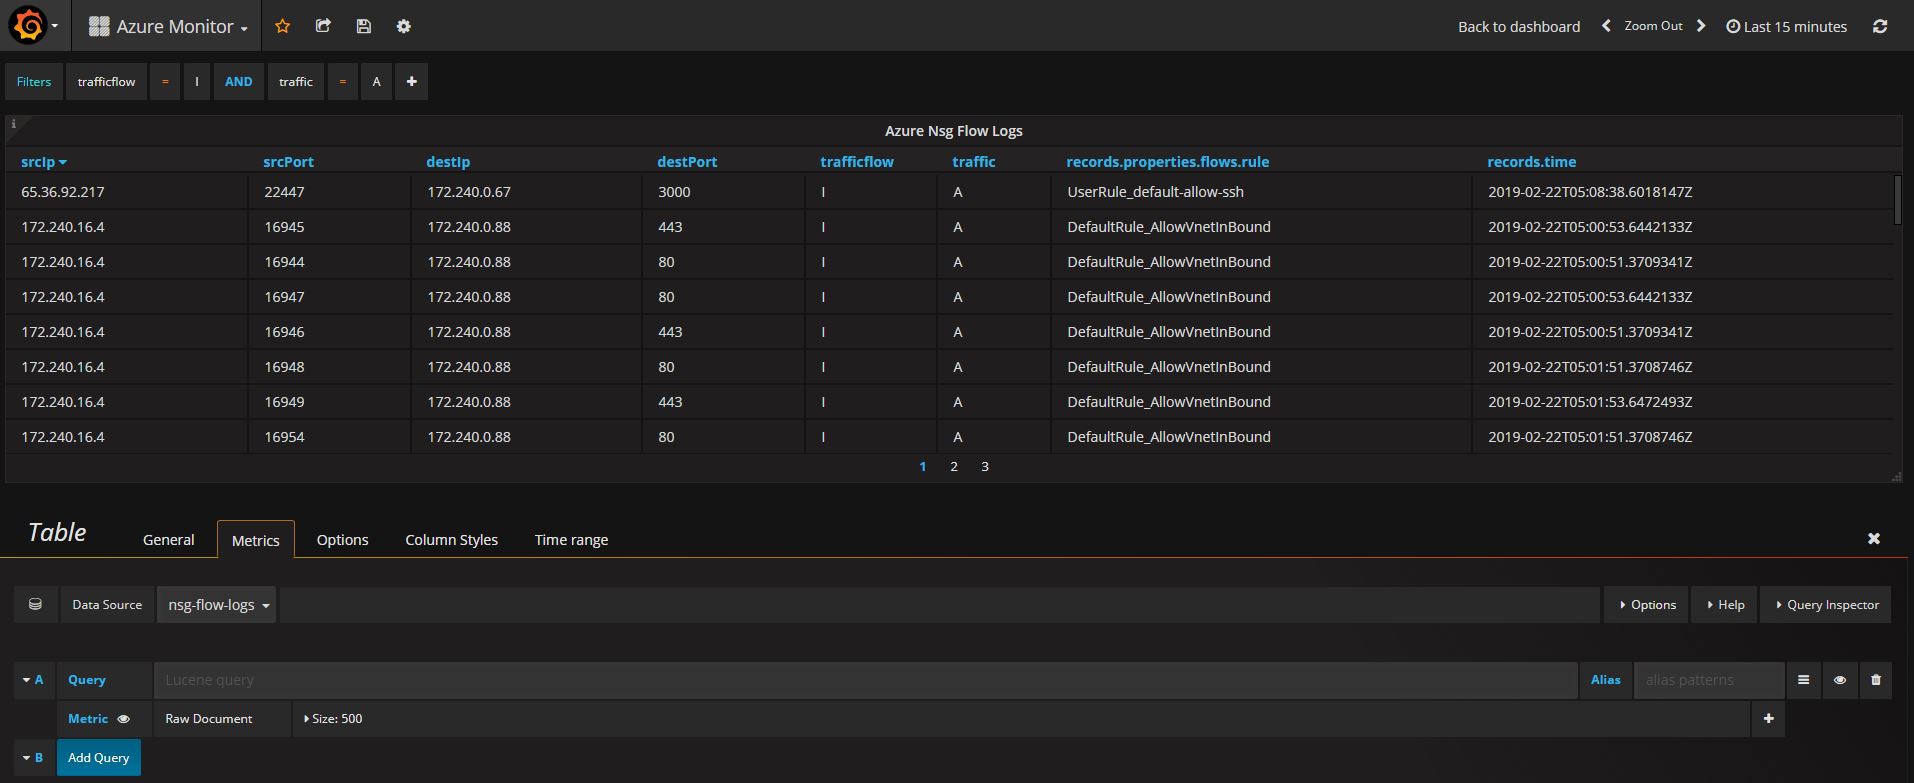
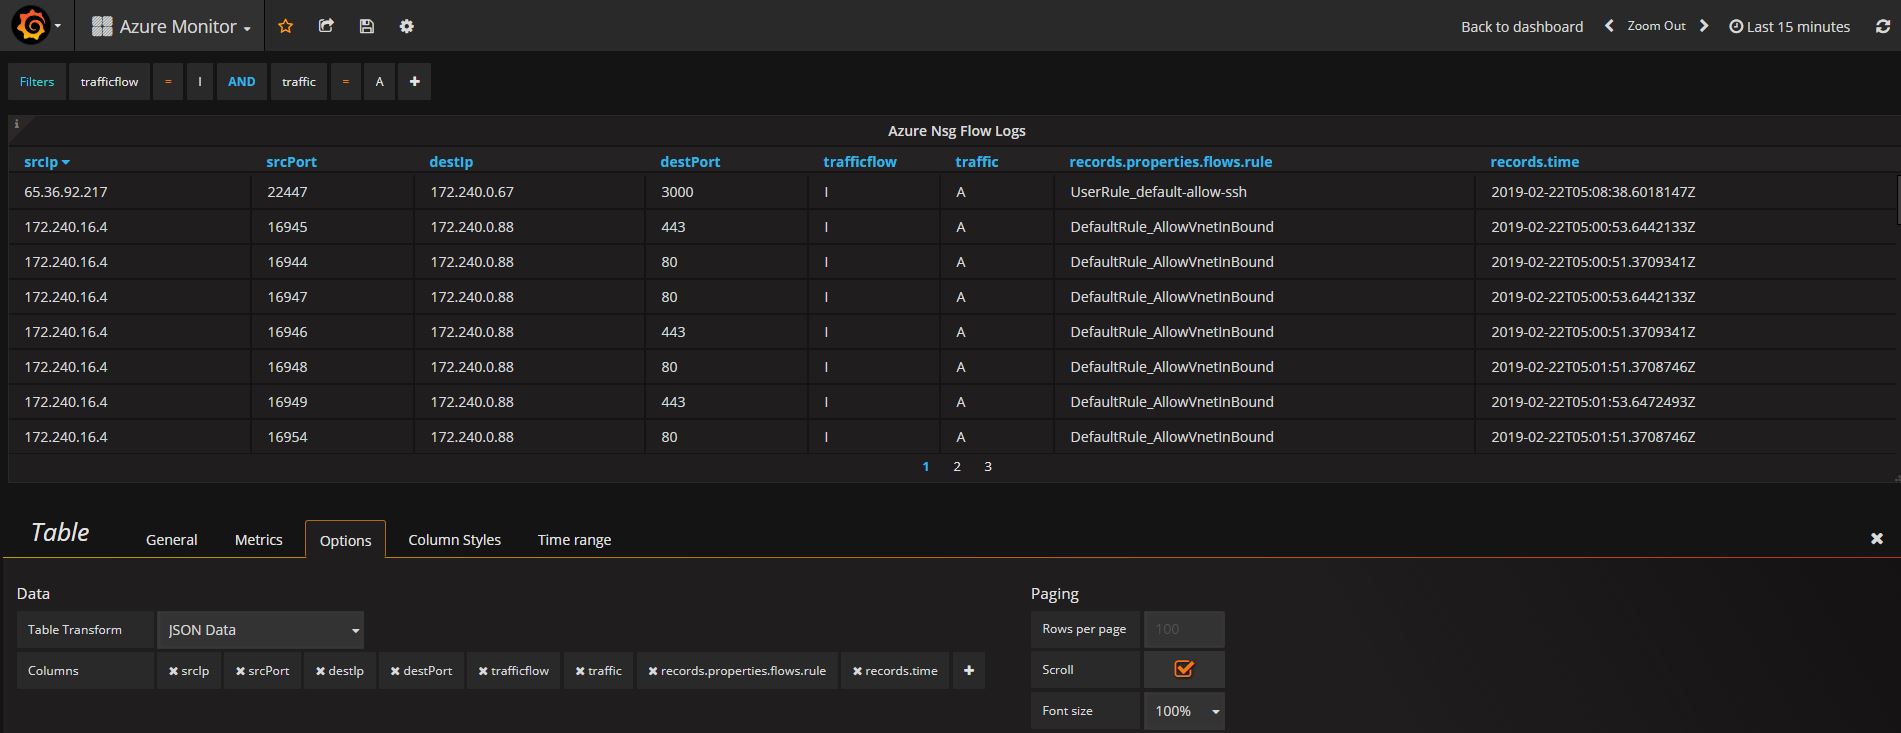
Go to Options tab where you can add columns you want to display. Grafana shows you the list of available columns and you just pick them in the order of your choice.
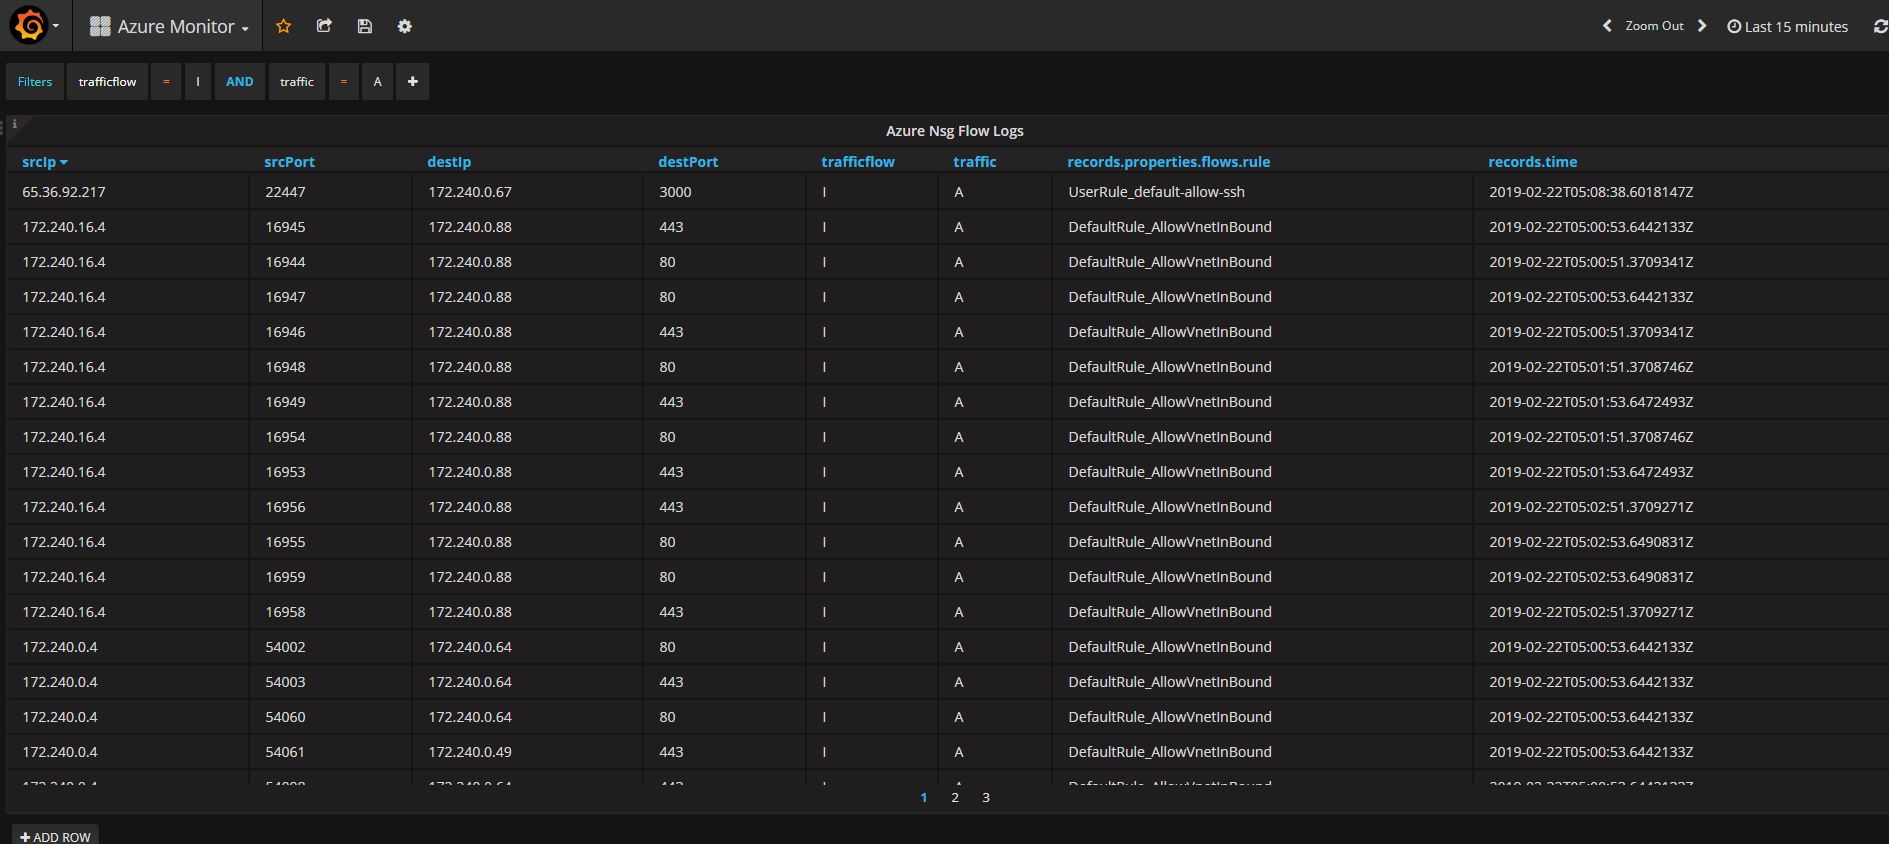
That’s all! You have the nsg flow logs at the finger tip!
We can get to see flow logs from API Gateway, NGINX proxy and services deployed in Kubernetes Cluster
Enjoy monitoring. :)-